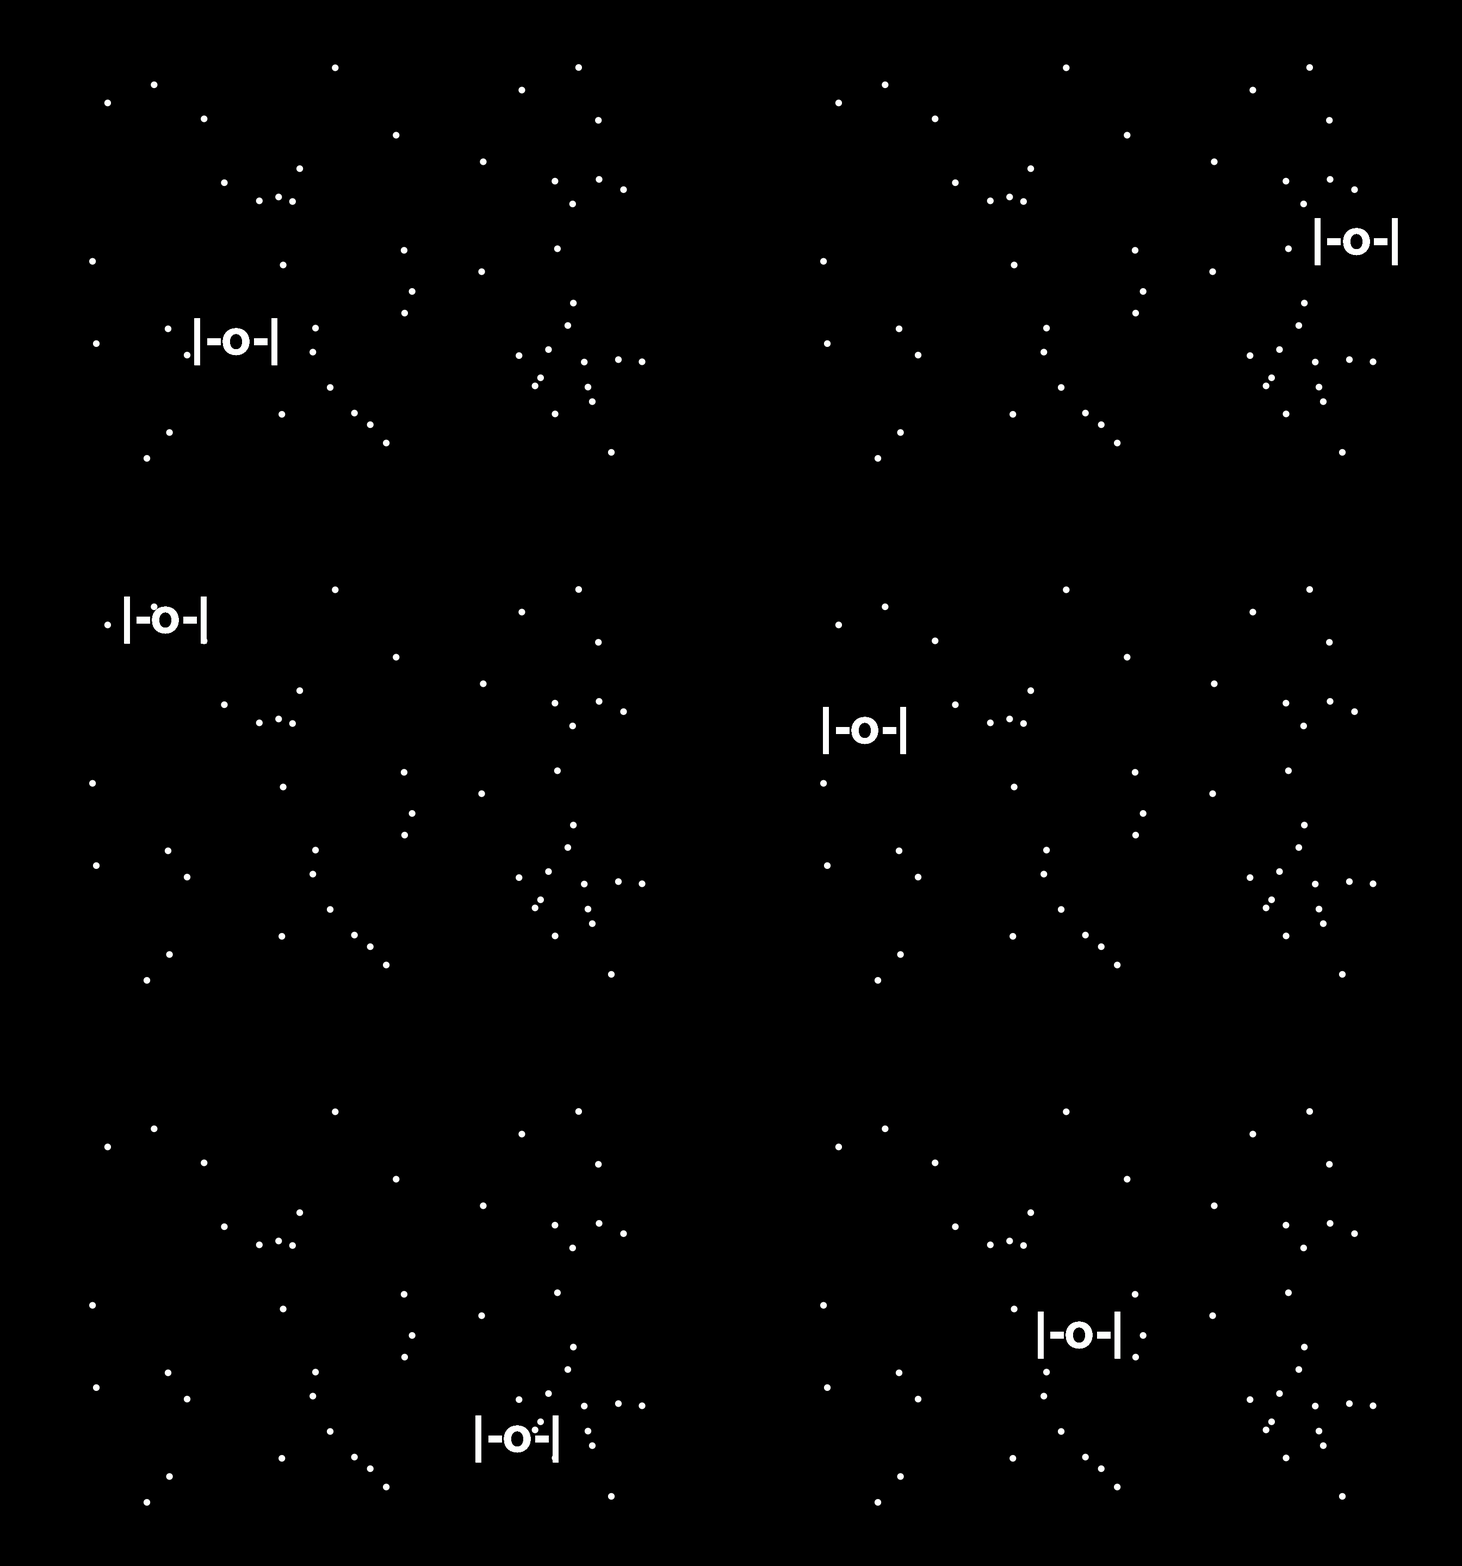
Happy Star Wars Day!
Rafael Irizarry has made a fabulous TIE fighter plot.
Jake Thompson recreated this plot using the {gganimate} package. I posted this amazing recreation in celebration of Star Wars Day (May the Fourth be with YOU!), and Rafa pointed out that the stars are missing!
So I’ve taken it upon myself to add them. Here you go!
library (tidyverse)library (gganimate)set.seed (20200504 )<- 20 <- 50 <- tibble (id = rep (seq_len (locations), each = n_stars),x = rep (runif (locations), each = n_stars),y = rep (runif (locations), each = n_stars),star_x = rep (runif (n_stars), locations),star_y = rep (runif (n_stars), locations),label = "|-o-|" ggplot (tie_data, aes (x = x, y = y, label = label)) + geom_point (color = "white" , aes (star_x, star_y)) + geom_text (color = "white" , fontface = "bold" , size = 12 ) + expand_limits (x = c (- 0.1 , 1.1 ), y = c (- 0.1 , 1.1 )) + theme_void () + theme (panel.background = element_rect (fill = "black" )) + transition_states (id, transition_length = 4 , state_length = 1 )
Check out the other amazing Star Wars - R content from the fabulous #rstats community!
