library(tidyverse)

spiderman <- read_csv("spiderman.csv",
                      col_types = cols(
                        date = col_date(format = "%m/%d/%y"),
                        domestic_box_office = col_double()
                      ))
cases <- read_csv("https://github.com/nytimes/covid-19-data/raw/master/us.csv")

# get daily cases from cumulative cases
cases <- cases %>%
  mutate(case = c(cases[1], diff(cases)))

d <- spiderman %>%
left_join(cases)Would seeing Spider-Man: No Way Home decrease COVID-19 Cases?
covid-19
statistics
causal inference
In SNL’s cold open last night, President Joe Biden suggested that the COVID-19 surge we are seeing in the US is due to people seeing Spider-Man: No Way Home. If people would just stop seeing this film, he argues, cases will go back down! Interesting hypothesis, let’s take a looksy at the data, shall we?
In SNL’s cold open last night, “President Joe Biden” suggested that the COVID-19 surge we are seeing in the US is due to people seeing Spider-Man: No Way Home. If people would just stop seeing this film, he argues, cases will go back down! Interesting hypothesis, let’s take a looksy at the data, shall we?
And now, a message from President Joe Biden. pic.twitter.com/Q8TglFNBlF
— Saturday Night Live - SNL (@nbcsnl) January 16, 2022
I pulled the domestic box office data from the-numbers.com and put them in spiderman.csv (if you want to code along, you can do the same! My .csv has two columns: date and domestic_box_office) and US COVID-19 cases from the NY Times GitHub repository. Here’s a little code-along.
Now, let’s look at the relationship between daily domestic box office and new COVID-19 cases in the US.
Warning: The following is a very silly analysis. It is a joke. Please do not try at home!
lm(case ~ domestic_box_office, data = d)
Call:
lm(formula = case ~ domestic_box_office, data = d)

Coefficients:
        (Intercept)  domestic_box_office
          3.559e+05           -3.691e-03
Oh my heavens! Not only does it not look like ticket sales for Spider-Man: No Way Home are increasing COVID-19 cases…it looks like the opposite. According to our very silly model, every $1,000 dollar increase in domestic box office sales results in a decrease of 3-4 COVID-19 cases! Pandemic solved! We just need to buy more Spider-Man: No Way Home tickets!! Since we’re looking at a silly analysis, let’s do something horrible, shall we? A double y-axis!
I just learned about the geomtextpath package from @timelyportfolio on Twitter, it’s amazing!
library(geomtextpath)


d %>%
  pivot_longer(cols = c(domestic_box_office, case)) %>%
  filter(!is.na(value)) %>%
  mutate(value = ifelse(name == "case", value * 120, value),
         name = ifelse(name == "domestic_box_office",
                       "Spiderman daily domestic box office",
                       "US daily COVID-19 cases")) %>%
  ggplot(aes(x = date, y = value, color = name)) +
  geom_point(alpha = 0.2) +
  geom_textsmooth(aes(label = name), hjust = 0.05,
                  method = "loess", formula = y ~ x) +
  scale_y_continuous("Spiderman Daily Domestic Box Office",
                     label = scales::dollar,
                     sec.axis = sec_axis(
                       ~ . / 120,
                       label = scales::comma,
                       name = "Daily new COVID-19 cases in the US")
  ) +
  theme_minimal() +
  theme(legend.position = "none") +
  labs(caption = "@LucyStats")  +
  scale_x_date("Date", limits = c(as.Date("2021-12-07"), NA))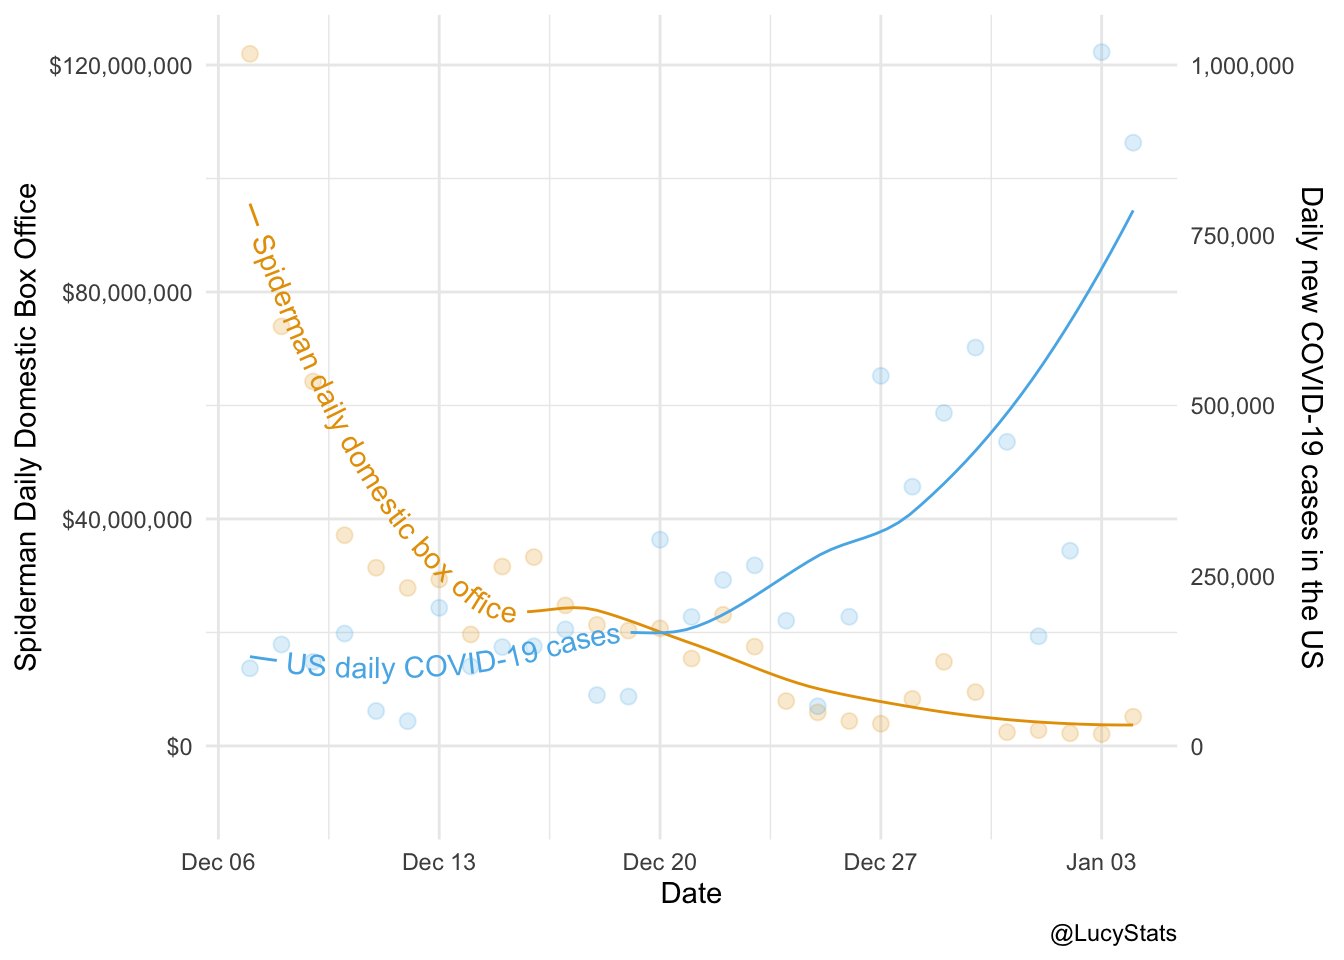
The actual SNL sketch claimed there was a one week lag – that Spider-Man sales a week ago caused cases 7 days later. Let’s check that too!
cases <- cases %>%
  mutate(case_lag = lead(case, 7))

spiderman %>%
  left_join(cases) %>%
  pivot_longer(cols = c(domestic_box_office, case_lag)) %>%
  filter(!is.na(value)) %>%
  mutate(value = ifelse(name == "case_lag", value * 120, value),
         name = ifelse(name == "domestic_box_office",
                       "Spiderman daily domestic box office",
                       "US daily COVID-19 cases (7 days later)")) %>%
  ggplot(aes(x = date, y = value, color = name)) +
  geom_point(alpha = 0.2) +
  geom_textsmooth(aes(label = name), hjust = .95,
                  method = "loess", formula = y ~ x) +
  scale_y_continuous("Spiderman Daily Domestic Box Office",
                     label = scales::dollar,
                     sec.axis = sec_axis(
                       ~ . / 120,
                       label = scales::comma,
                       name = "Daily new COVID-19 cases in the US (7 days later)")
  ) +
  theme_minimal() +
  theme(legend.position = "none") +
  labs(caption = "@LucyStats")  +
  scale_x_date("Date", limits = c(as.Date("2021-12-07"), NA))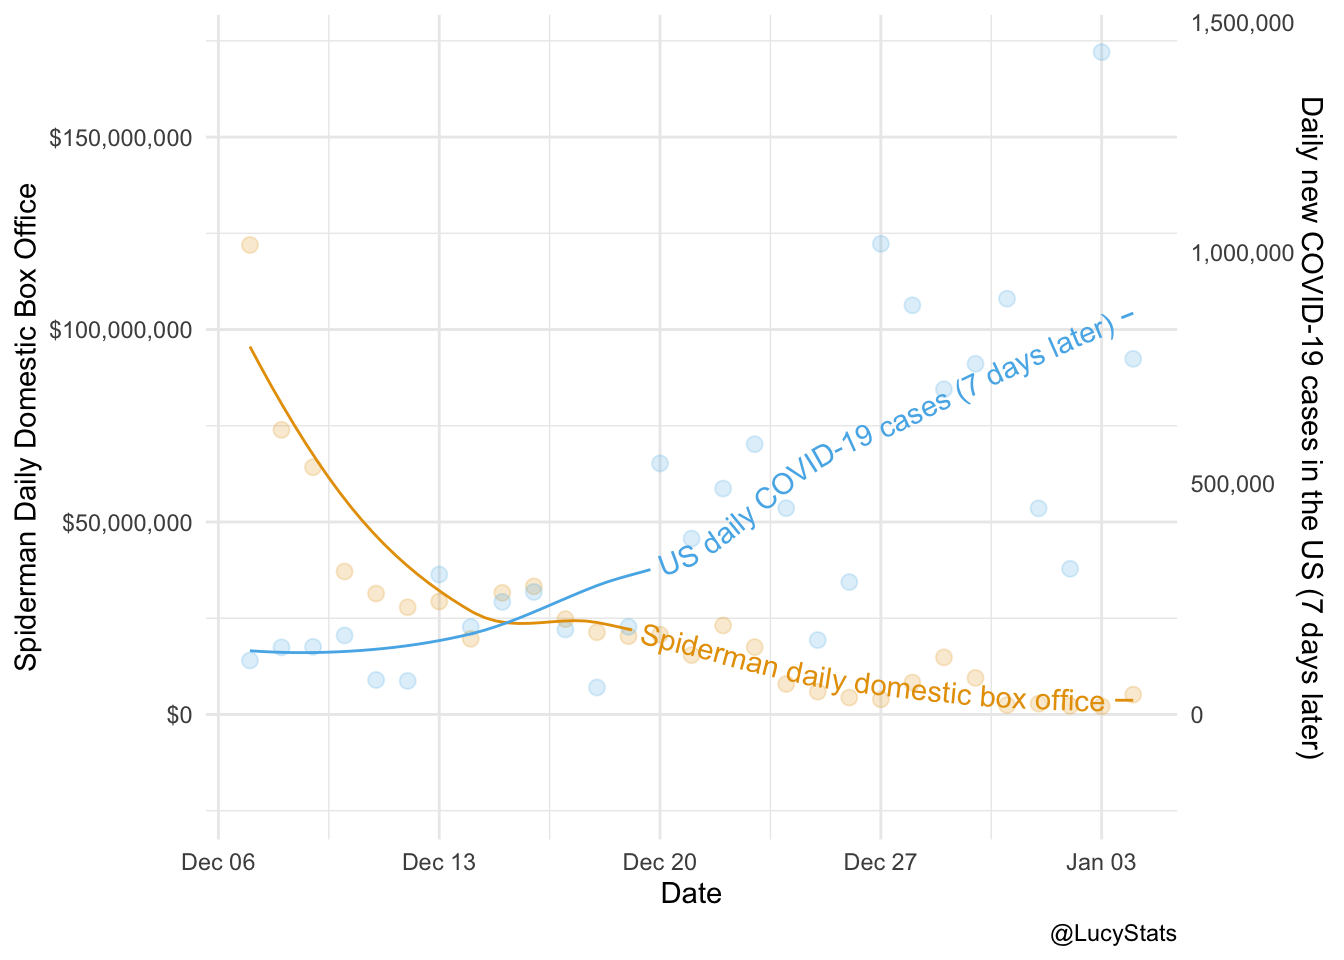
Well there you have it. It looks like SNL was onto something, but got it backwards! Just kidding.
So new claim! a higher Spider-Man: No Way Home domestic box office would lead to fewer COVID-19 cases. Let’s talk about how we can think about this claim from a causal perspective if it was presented as I have done here. There are lots of ways to introduce causal thinking; in my class, one of the first ways I like to get my students thinking about causal assumptions is via Hill’s Criteria. These are 9 things to think about when trying to assess whether an association is causal; it is not meant to be a checklist (and the list is not exhaustive!) but I find it is a nice way to dip your toe into causal thinking.
Strength
The first criteria is what is the strength of the association. Our goofy linear model suggested that 16% of the variability in the number of daily cases in the US could be explained by the Spider-Man: No Way Home domestic box office. Is this strong? The coefficient in our linear model suggests that every $1,000 dollar increase in domestic box office sales results in a decrease of 3-4 COVID-19 cases! That sounds pretty strong? I’m not sure this criteria is helping me assess whether this relationship is causal so I’m going to move on to the next one and rate strength as 🤷.
Consistency
Have other studies shown a similar association? I’m going to say no…consistency is going to get rated as 👎.
Specificity
Specificity means the exposure of interest (in this case Spider-Man domestic box office) only causes one thing (and that thing is a decrease in COVID-19 cases in this case). I’m going to go with no again. 👎.
Temporality
Does the cause precede the effect? Kind of? It looks like sales are decreasing rapidly from Dec 7th through Dec 20 and cases appear to dramatically increase thereafter? But wait! Could the opposite be true? What if the surge in COVID-19 cases is causing a decrease in box office sales? (Acutally there may be some merit to this, but also we can just look at box office trends and see that they tend to decrease over time since lots of excited people go the first weekend and fewer as time goes on but I DIGRESS!) I’m going to give this a 🤷.
Biological gradient
Do we see a dose effect? Indeed we do! As domestic box office decreases, COVID-19 cases increase, so can we infer the opposite, if domestic box office sales were to increase, would we see fewer COVID-19 cases? From our little window of data it looks like we can’t know (but reality check, if we had started the analysis from the day before, we actually have box office going from 0 to $121,964,712 and we don’t see a precipitous drop in COVID-19 cases, so I’m going to give this one a 👎).
Plausibility
Is this plausible? No, it’s silly. 👎
Coherence
Is there a coherent argument to be made? Again, no. 👎
Experiment
Was there a randomized trial // some attempt at estimating a causal effect to explore this relationship? Nope. 👎
Analogy
Is there strong evidence for a similar exposure (something like Spider-Man box office sales) to cause a similar outcome (a decrease in COVID-19 cases in the US)? Nope. 👎
Ok, so using these criteria, let’s assess the overall likelihood of a causal effect:
Strength 🤷
Consistency 👎
Specificity 👎
Temporality 🤷
Biological gradient 👎
Plausibility 👎
Coherence 👎
Experiment 👎
Analogy 👎
I’m going to go ahead and rate this one 👎 not likely causal! Sorry! Looks like increasing box office sales of Spider-Man: No Way Home is not likely to get us out of the pandemic.