library(tidytext)
library(mdr)
library(tidyverse)
<- transcripts |>
df mutate(timestamp_seconds = as.numeric(timestamp),
bin = floor(timestamp_seconds / 180) * 180) |>
left_join(episodes, by = c("season", "episode"))
|>
df mutate(id = glue::glue("Season {season} Episode {episode}\nWritten by: {writer}")) |>
unnest_tokens(word, dialogue) |>
inner_join(get_sentiments("afinn"), by = "word") |>
group_by(id, bin) |>
summarise(sentiment = mean(value)) |>
ggplot(aes(x = bin, y = sentiment, fill = sentiment > 0)) +
geom_bar(stat = "identity", alpha = 0.8) +
scale_fill_manual(values = c("#C15C58", "#5BA9D0")) +
scale_x_time(labels = scales::time_format("%M:%S")) +
labs(x = "") +
facet_wrap(~id, ncol = 3) +
theme_mdr() +
theme(
strip.text = element_text(size = 8),
legend.position = "none",
panel.grid.minor = element_blank(),
panel.grid.major = element_blank())
How are we feeling: A Severance Analysis
rstats
severance
data visualization
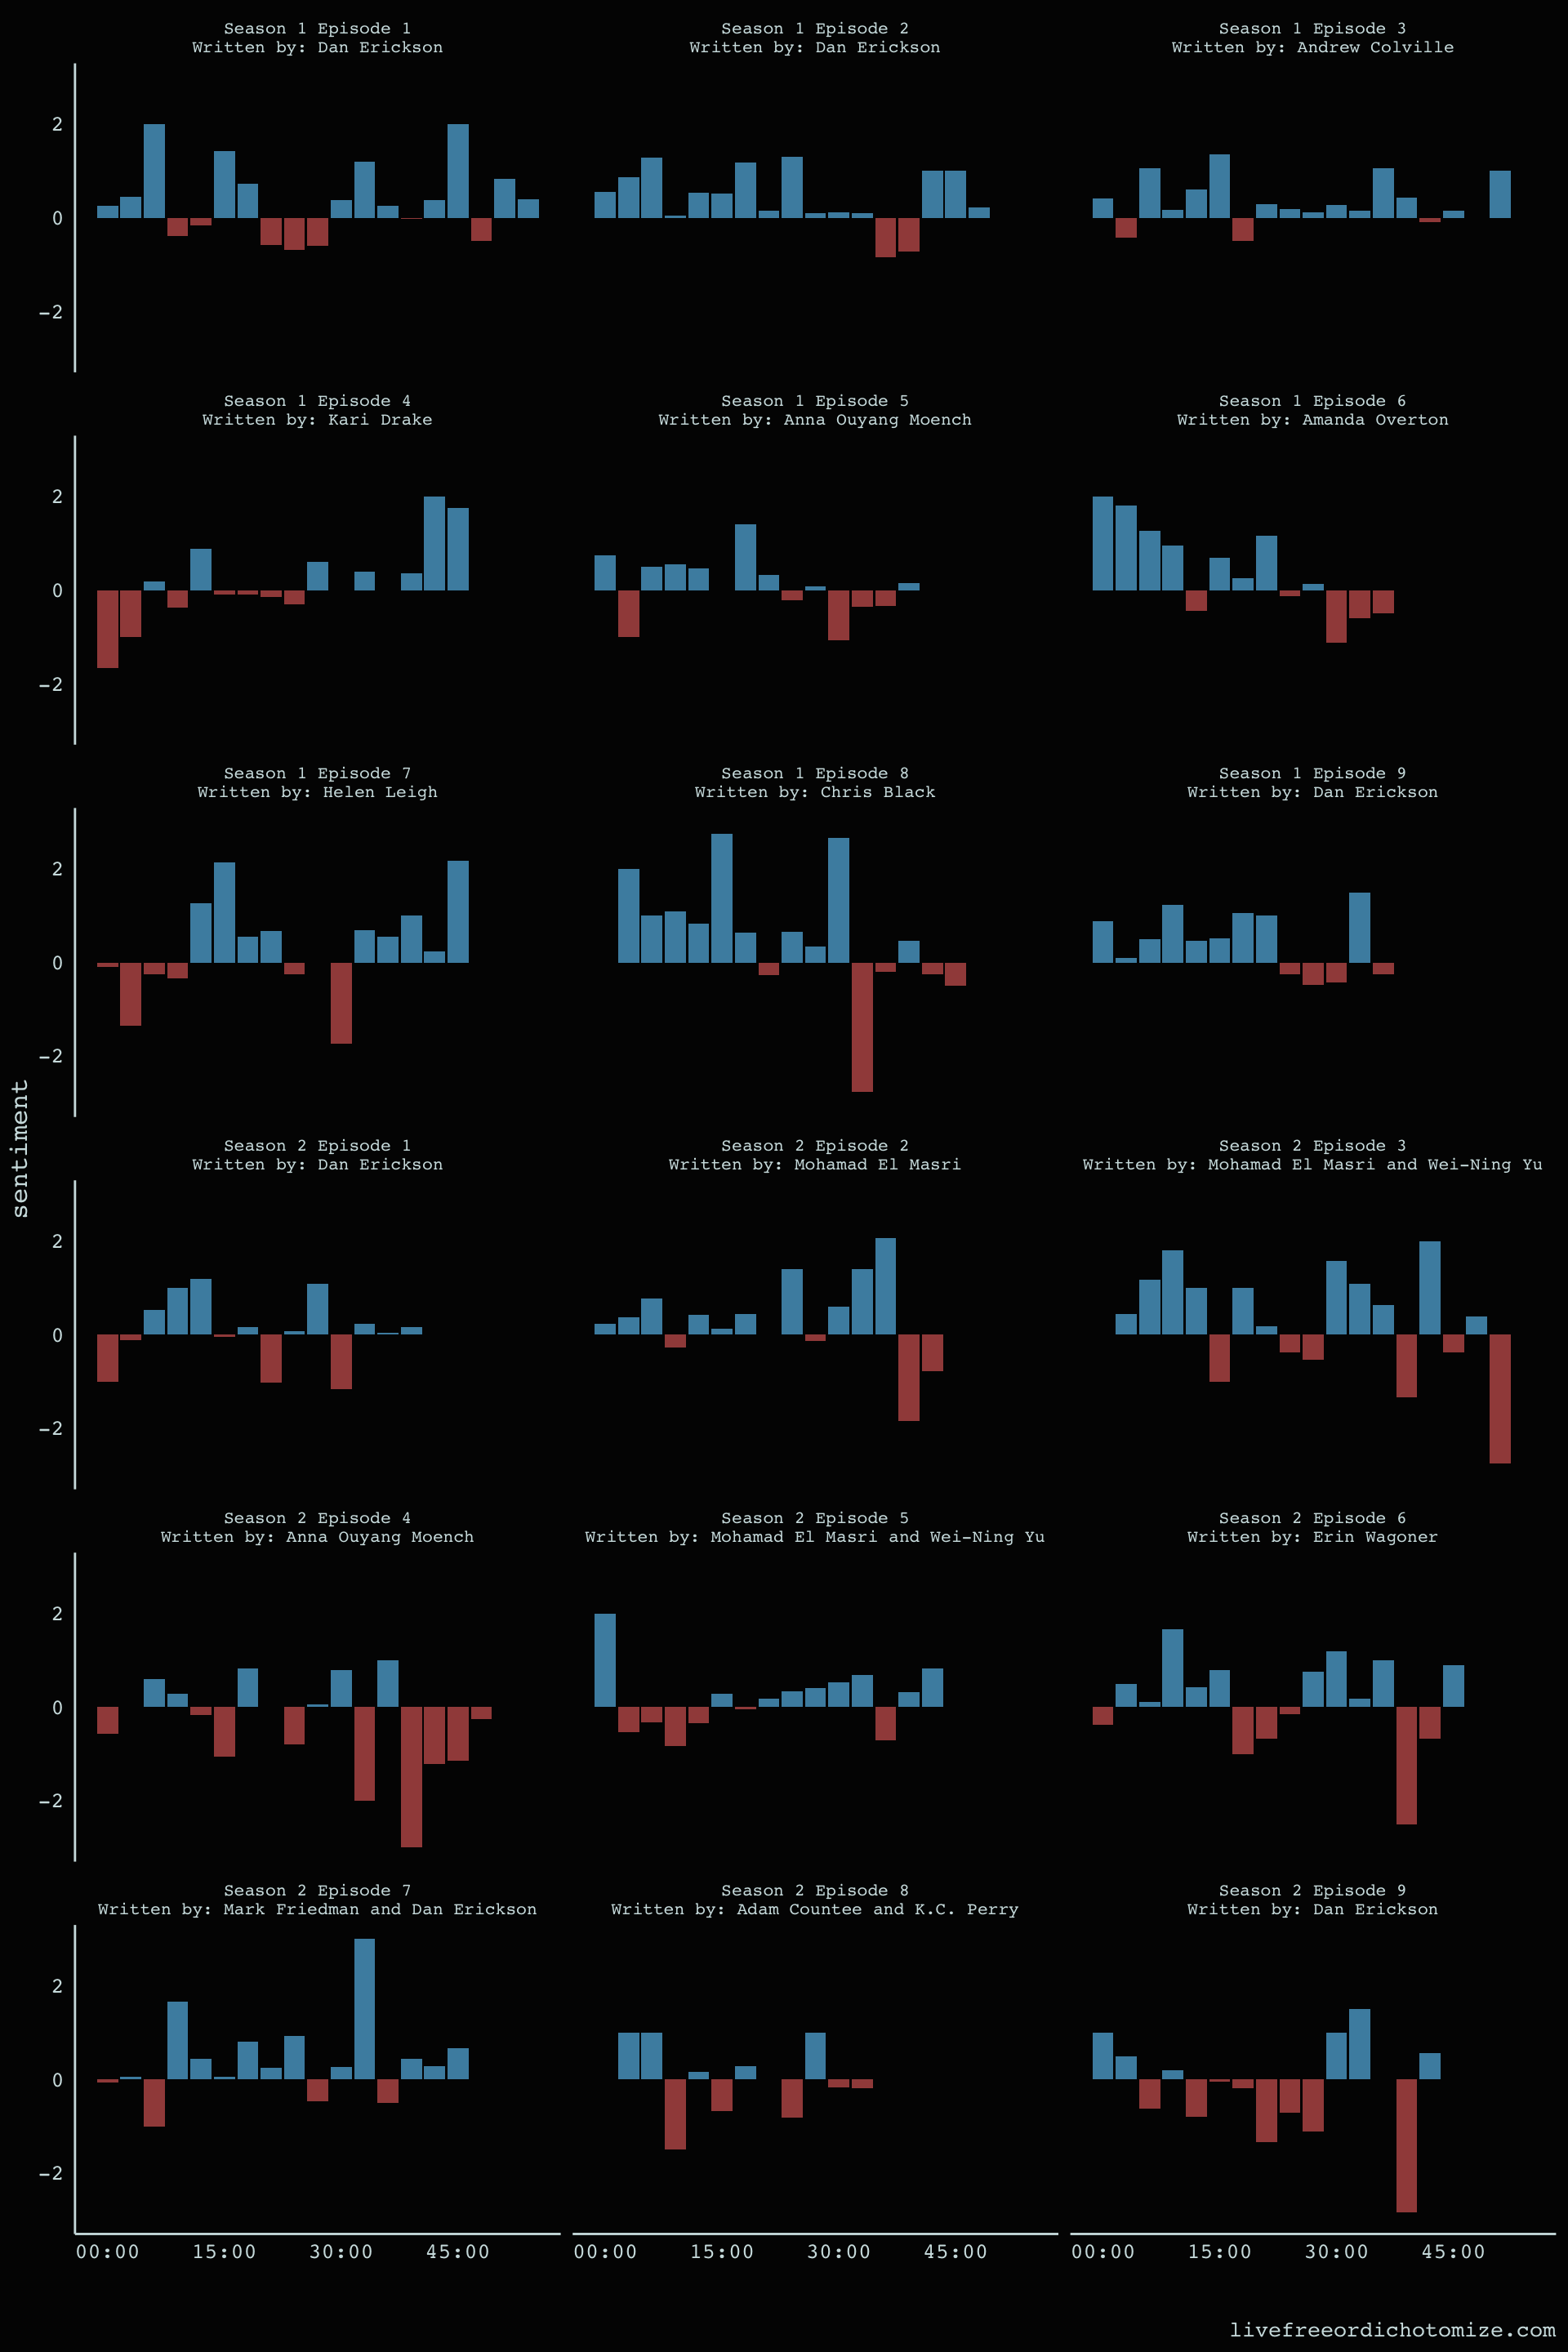
We create a little sentiment profile for each episode, binning them in three minute increments and calculating the AFINN average sentiment score in each.
This analysis was made possible by the mdr R package, which used data originally compiled by the Severance wiki. Here, we create a little sentiment profile for each episode, binning them in three minute increments and calculating the AFINN average sentiment score in each.
This post was originally posted on my Severance themed site [found here].